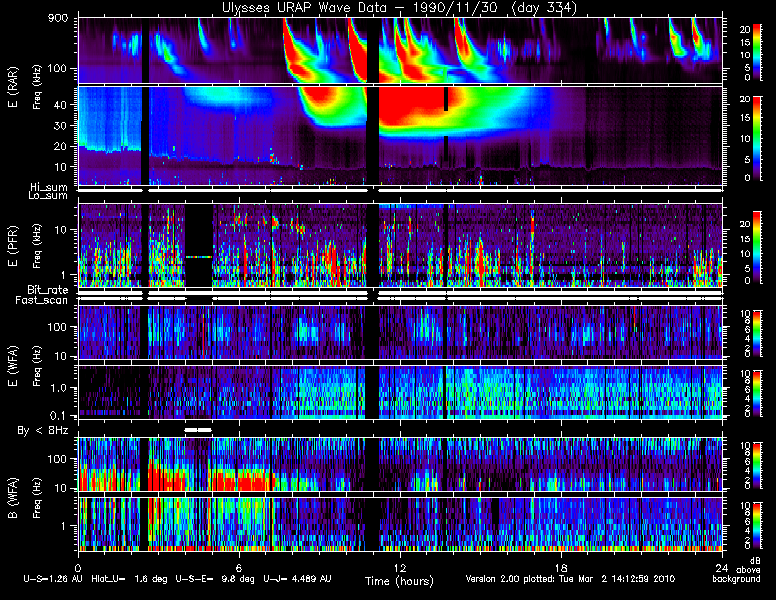
Each of these instruments, like all sensitive wave receivers, is affected by interference from other sources. For the RAR Hi band, an interference signal at 81 kHz is produced by the Ulysses GAS instrument. Depending on the mode in which the GAS instrument is operating, this interference can occur from 0 to 24 hours per day. If an algorithm determines that this interference is present in more than about 10% the RAR data for the day, we remove the 80 kHz data and interpolate from adjacent frequencies. The RAR Hi band also has an enhanced background at 120 kHz (source unknown). Subtraction of this enhanced background can cause artifacts in other events, like type III bursts. See Nov. 30, 1990 as an example.
 |
The RAR Lo band has an interference line at 8.75 kHz and odd harmonics caused by the Ulysses traveling wave tube amplifier (TWTA), which is part of the high gain telemetry system. In general, this signal is removed by the background subtraction, sometimes producing artifacts in weak radio events or the thermal noise spectrum at these frequencies.
The PFR experiences interference from the URAP Sounder; these data are removed from the plots and appear as short data gaps. The background levels of the PFR depend on bit rate, PFR mode, and the cadence of the URAP Fast Envelope Sampler (FES data not presented in these plots); these background variations can affect the appearance of events at the transition from one mode to another.
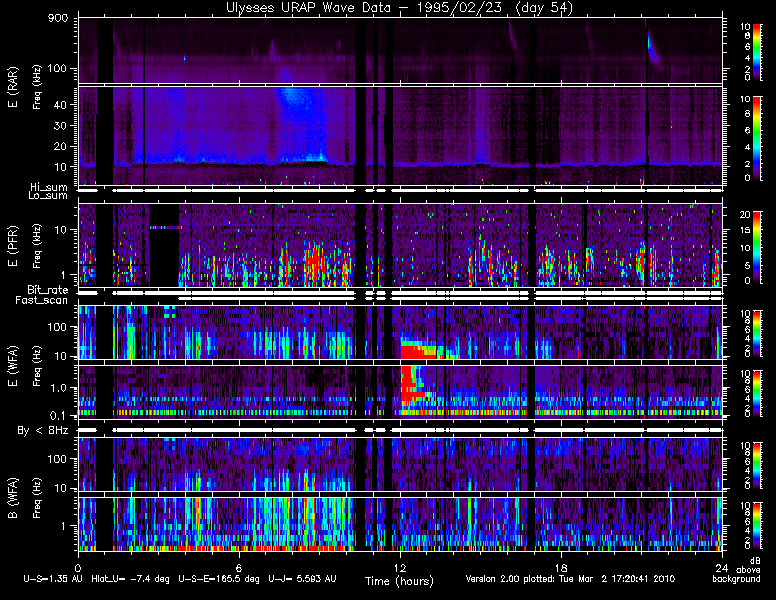
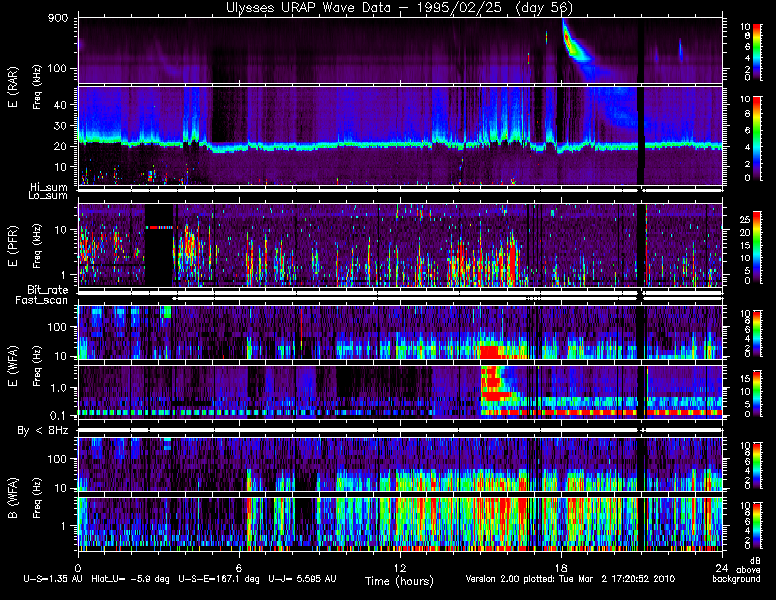
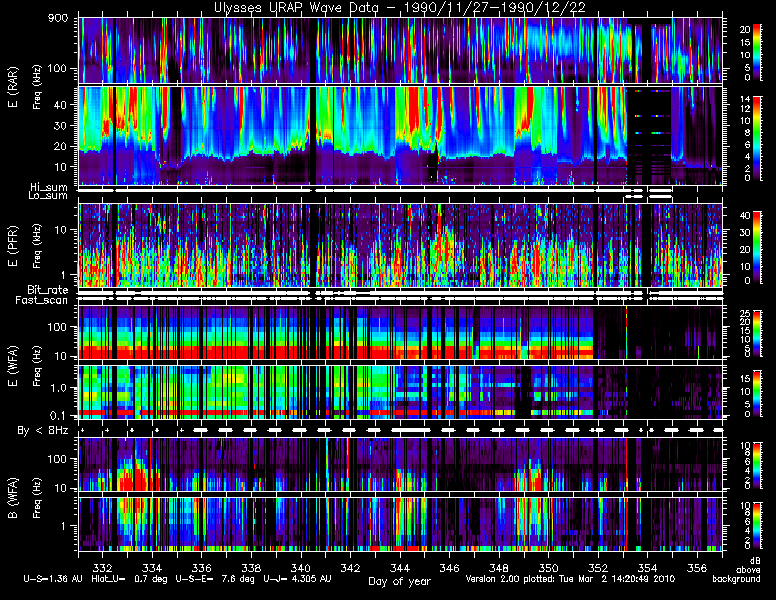
The WFA data are affected by numerous interferences, of which the URAP PFR is the dominant source. WFA "backgrounds" vary significantly depending on whether the PFR is in fast or slow scan mode or fixed tune, so separate backgrounds are calculated for each of these. The URAP Sounder also causes interference; these data are removed from the plots and appear as short data gaps. Spacecraft thruster operations produce a variety of artifacts in the data; since we have no indication of these in our telemetry, they are not flagged on the plots. Examples may be seen on Feb 23, 1995 at 12:00 and on Feb. 25, 1995 at 15:00. An interesting "interference" is seen to disappear on Dec. 17, 1990; this is when the spacecraft nutation was stopped. This is best seen on the 26- day plots.
 |
 |
 |
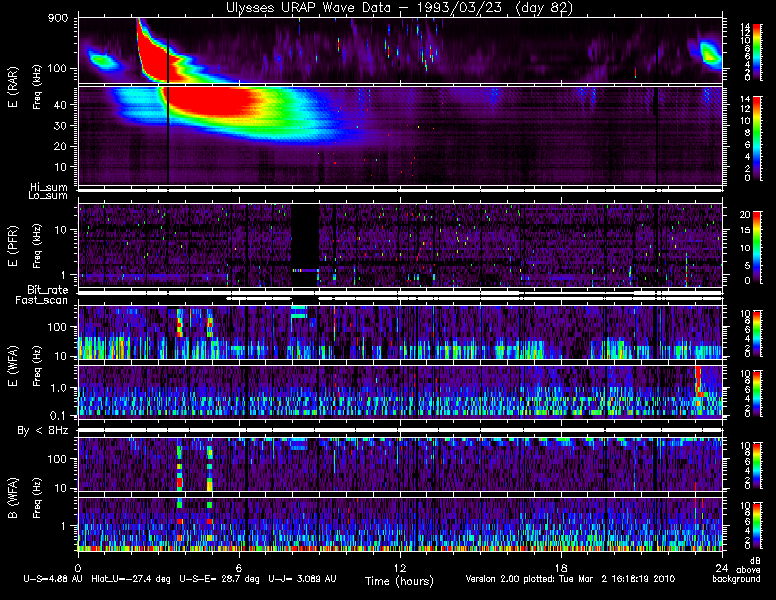
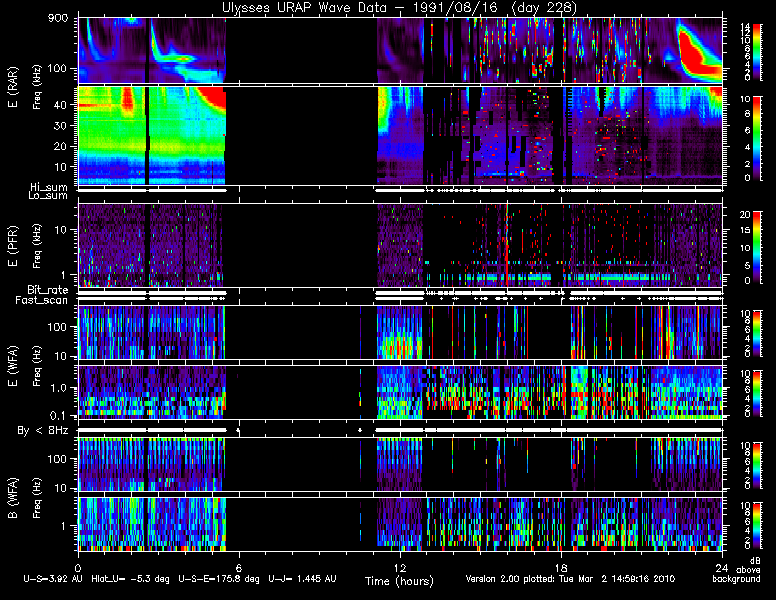
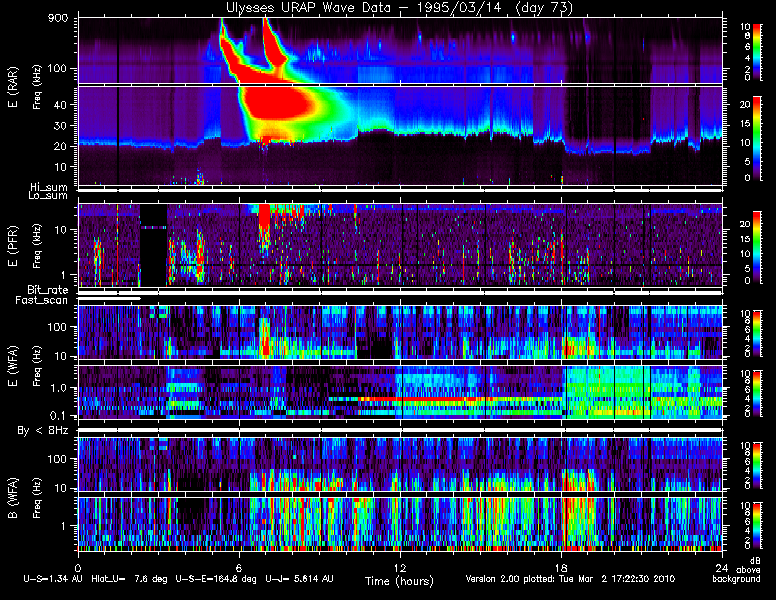
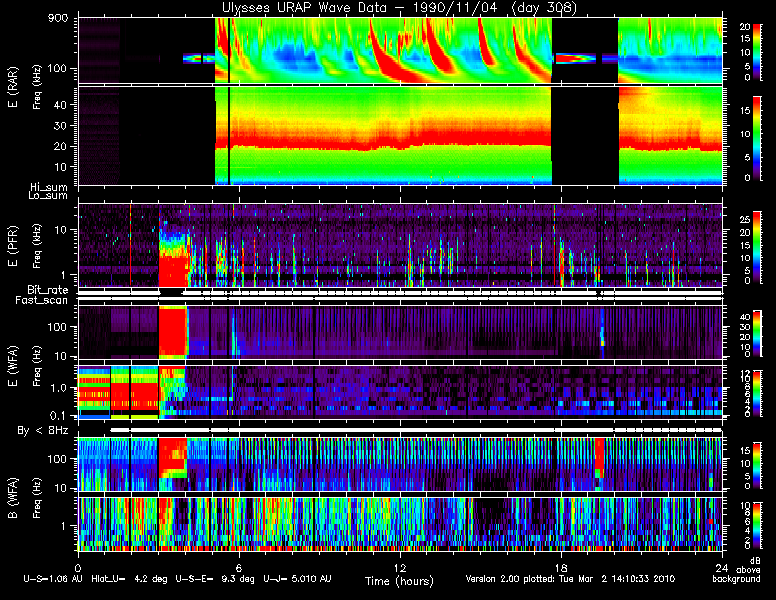
To summarize, there are a variety of artifacts in the wave data that affect interpretation. These can result from corrupted telemetry values (producing bad pixels (most evident in the RAR plots, see March 23, 1993, from 6:00-14:00, or August 16, 1991, a very good example of very bad data quality), interferences (e.g., non-physical, block-like structures sometimes seen in the highest frequencies of the WFA E and B data (see March 14, 1995)), or changes of the instrument mode or the physical medium (e.g., a short interval of data with a very low signal level defines a background for the rest of the day that is not appropriate; see Nov. 4, 1990, when the Ex antenna was deployed).
 |
 |
 |
< |